MountainScenarios

Category: Scenario Planning & Delphi Research Page 2 of 3

Pandemic Scenario in Trump Transition Team, Days before Office

Okay!. So the Obama administration left the incoming Trump administration several scenarios for them to think about. No evidence as to what happened to the final report. But apparently, it showed everything that we have seen since November in China, and the first outbreaks outside of China. The result was a world-wide pandemic. Overwhelming the US with supply shortages and patent overflows. What happened to the final report? The early warning signposts? The disaster (recovery) plans?

We did a blog post about the military planning scenarios that would have realized a pandemic as an act of war… Or, even if it wasn’t caused by an act of war, the resulting story line would be similar. And, of course, if the pandemic started elsewhere, there would signals and signposts, in the jargon of Shell related to early warning signs in scenario planning.

A major country should be doing military scenario planning for several topics. None is quite as huge and integrated as climate change. Look at this report produced by The National Security, Military, And Intelligence Panel on Climate Change (NSMIP, February 2020), A Security Threat Assessment of Global Climate Change: How Likely Warming Scenarios Indicate a Catastrophic Security Future. It doesn’t seem possible that the US would not have a plan like this for a pandemic? It also doesn’t seem possible that the US would not have multiple plans for economic recession, no matter the cause. Since we missed the boat on the pandemic, hopefully we didn’t miss planning for a recession… However, this recession is like none we have ever had before. Kind of like turning the switch off on most of the economy for a while. (How long is a “while” is a $4T question?)

Kiaser Health News did a composite of highlights from several articles about the Trump transition team and how badly they apparently failed in the Pandemic exercise: How A Crisis Simulation Run Before Trump’s Inauguration By Obama’s Team Eerily Mirrors Current Outbreak!

November in China. By December, the military and health official had to know that expansion into a global pandemic was was not only possible, but likely. In Florida, when we see a Hurricane coming, we dust off all of our contingency plans for the businesses and start buying toilet paper and canned goods. We make sure that we have lots of jugs to fill with water if needed (no need to buy water, by the way).

Did the military and health officials simply forget to mention these things up the chain of command, or — apparently more likely — did the higher-up-the-chain-of-command not listen? What the hell happened to the results of the simulation? Did it take the path of anything and everything that Obama did/mentioned/signed/said, flushed down the toilet?

Military Scenario Planning

It is hard to imagine a world where the (US) military did not make plans for a pandemic like the coronavirus (COVID-19). Each and every military must have a plan for weaponized bio-warfare. In fact, every military will have their own plans for ways they can weaponize biowarfare. Think about the types of bioweapons the terrorist groups might want to employ?

The military has been planning for the big issues of global warming and has been shouting out that climate change is one of the biggest risks to the world in the future. Droughts and rising sea levels will produce mass instability in regions, much along the line of the human tragedies in Chad, Sudan, Syria, etc. For decades now, the military has warned of the risks of climate change on US national security. Pentagon, for example, here.

With the pandemics that have passed through (Ebola, SARS, mosquito-borne) over the last 10-20 years, this too is a national security threat.

In the spirit of Scenario planning, setting up sign-posts and early warning signs, you have to wonder when the military started to escalate the coronavirus outbreak in China to the highest risk levels of world, and therefore US pandemic. November? December? The military would already have contingency plans to help other countries. By early December 2019, the signposts were visible for a spread from China to the rest of the world. By mid December, the US mainland would have been clearly at risk.

The power of having scenario plans, early warning signs, and contingency plans, can break down anywhere along the line. All of the planning in the world is useless, if you don’t react and implement.

Y2K Scenarios

Scenario Planning when the Official View of the Future is Uncertain

Scenario planning should be back in focus. We go a few years – 10 years now since the Great Recession – and we think that the current trajectory, or the “Official View”, should be consistent this time. But the corona virus brings that all back into focus, even though people are probably not taking it as seriously as they probably should. You have to look at the entire supply chain forward and backward. China plays a major role in many of the world’s supply chains. End consumers on the one hand; production supply chain on the sourcing side. If factories are closed, if people can’t go to work, if people don’t go out and buy the consumption and the supply chain get continually interrupted. China is initiating all kinds of stimulus. Telling banks to be forgiving on impacted factories seems like a good idea; no one wants the factories to go out of business because of such an exogenous event such as the virus. But other stimulus will be rather useless.
Probably no one knows, yet, how this epidemic will play out. There’s no reason to believe that this won’t be rather long and protracted for China. The consequences for China will ripple throughout the world. With a world that is densely (over) populated, there is no reason to believe that such outbreaks will not happen other places, and more frequently.
So, this brings us back to scenario planning. The advantage of scenario planning is that you can build Contingency or Disaster Recovery Plans based on various scenarios. Serious and protracted supply chain disruptions, no matter the cause, seem like logical scenarios.

Right now might be a good time to dust off the Contingency Plans and see if anything needs to be updated, or executed, because of the recent events.
In the 2018 Guide by Hall and Hinkelman, the scenario chapter discusses Y2K as the greatest scenario planning exercise in history. Read about the Y2K Scenario from that chapter (pp. 161-163). Remember that right now many companies are executing their contingency plans related to current events, many others are trying to develop them on the fly – kind of a fly-by-night approach to scenario planning.

<*This section below is reproduced here with permission of the authors.*>
The Great Scenario Planning Exercise, Y2K!
There were several major advantages to corporations’ planning – scenario planning really – that came out of the Year 2000 (Y2K) preparation process. Planners were forced to consider at least two views of the future: the official view where Y2K caused no interruptions, and the view of chaos where it caused massive interruptions (mainly because of sustained interrupts to the power grid). One of the interesting parts of this process is the spillover implication – legally, morally and brand-image-wise – of doing nothing in preparation and being wrong. The scenario planning processes associated with Y2K resulted in stronger business planning and improved disaster recovery plans (DRPs). It also helped with business continuity plans by building stronger relationships with critical business partners.
Many people would say that this is a bad example because Y2K was a bust. Actually, the major push to organize IT and transition from legacy systems has substantially contributed to increased productivity for several years after the turn of the century. Business productivity has been surprisingly low since about 2005. Two examples where the Y2K efforts proved to be well justified are Burger King and FPL.
Burger King Corporation, then a division of DIAGEO, worked very closely with franchisees and its most critical suppliers (beef, buns, fries and Coke) to make sure that there would be no interruption and that contingency plans would be in place for likely situation related to Y2K. By far the biggest risk, and the most attention to contingency planning, went to AmeriServe. AmeriServe was the number one supplier to the Burger King system that had bought out the number two supplier and now represented three-fourths of the global supply chain. Three weeks into the new Millennium, AmeriServe declared bankruptcy! The contingency plans related to distribution had fortunately been dramatically improved during 1999 and continuity actions were immediately executed. Although it had nothing to do with Y2K, per say, much if not the entire contingency plan could be used for any distributor outage.
An adjunct to the Y2K story relates to power. Once organizations got past addressing their critical IT systems, the biggest wild card was power outages. No assurances came from the power companies until just months before the turn of the millennium, and even then, not much was given in the way of formal assurances. Of course, that was too late for a big organization with brand and food safety issues to have avoided the major contingency planning efforts.
Most people did not realize how fragile and antiquated the entire power grid was until the huge Ohio, New England and Canadian black out August 14, 2003 (CNN). A cascading blackout disabled the Niagara-Mohawk power grid leaving the Ottawa, Cleveland, Detroit and New York City region without power. There was a shutdown of 21 power plants within a three-minute period because, with the grid down, there was no place to send the power. Because of a lack of adequate time-stamp information, for several days Canada was believed to be the initiator of the outage, not Iowa.
There have been similar blackouts in Europe. That Y2K could have resulted in massive outages may not have been so far-fetched after all. Ask someone who was stuck in an elevator for eight hours if the preparations for long-term power outages could have been better.
Hall (2009) developed a survival planning approach that would help an organization survive during times of extreme uncertainty, like the Great Recession. Of course, the process is far ahead if the organization already has a good strategic plan (StratPlan) that includes contingency and scenario planning.

References

Hall, E. (2009). Strategic planning in times of extreme uncertainty. In C. A. Lentz (Ed.), The refractive thinker: Vol. 1. An anthology of higher learning (1st ed., pp. 41-58). Las Vegas, NV: The Lentz Leadership Institute. (www.RefractiveThinker.com)
Hall, E. B. & Hinkelman, R. M. (2018). Perpetual Innovation™: A guide to strategic planning, patent commercialization and enduring competitive advantage, Version 4.0. Morrisville, NC: LuLu Press. ISBN: 978-1-387-31010-4 Retrieved from: http://www.lulu.com/spotlight/SBPlan

The Future of Computers and Quantum Computing Part Duex

On April 4, 2019 the DC chapter of the IEEE Computer Society Chapter on Quantum Computing (co-sponsored by Nanotechnology Council Chapter) met to see a presentation by and IBM researcher named Dr. Elena Yndurain on the subject of recent efforts by that company in the realm of quantum computing. I was fortunate enough to be able to attend. I was hoping the presentation would be technical enough to be able to better understand the basics of quantum computing in the sense of a future time-line of when this new technology would be ready for the market place as defined during the course of my own research (Jordan, 2010) which is to say that a working prototype would be ready for full-scale testing. I was disappointed.

During the set-up for the real purpose of the talk, the presenter stated that the phases of quantum computing could be thought of as being in three phases of increasing complexity: (a) quantum annealing; (b) quantum simulation; and, (c) universal quantum computing. Ultimately, the goal would be (c). But the current state of the technology is (a).

It was also stated that there were essentially three possible technologies for quantum computing: (a) super conducting loops; (b) trapped ions; and, (c) topological braiding. Both (a) and (c) require cryogenic cooling. The IBM device uses technology (a) that is cooled down to 15 miliK0 (whew!). Technology (b) involves capturing ions in an optical trap using lasers. This technology operates at room temperature but suffers from a signal-to-noise problem that (a) does not. Technology (c) was not discussed.

The IBM device is a 50-qubit machine. The basic functionality of the device is predicated on Shor’s algorithm (Shor’s algorithm, 2019) and Grover’s search algorithm (Grover’s algorithm, 2019). These mathematical algorithms were developed during the 1990s. They are complex functions so there is a real part and an imaginary part. When queried the presenter stated the gains achieved by this so-called quantum annealing device were from the simplicity of the computation not the speed of the processor. The presenter went on to say that the basic algorithms had been coded in Python (Python (programming language), 2019).

That the IBM device is based on a 50-qubit processor struck me as being a bit coincidental. Recall from my first post on this subject, there has been an effort (by some unidentified group) to develop a fault-tolerant 50-qubit device since 2000. As of the publication of the paper this had not been achieved (Dyakonov, 2019). When I asked about this, the presenter simply stated that the IBM device was fault-tolerant but declined to offer any specific statistically based response. It should be stated that, during the presentation, Dr. Yndurain remarked that information included was cherry-picked [my words, not hers] to put things in the best light. Why?

During the presentation, what became clear is that IBM is building an ecosystem around the 50-qubit device. They have rolled this thing about as the “Q” computer. In order to gain access to the device, researcher must “subscribe” to the IBM service or simply “get in the que”. One also has to go through a training/vetting process to be able to develop the particular program the researcher needs to solve a particular problem. Seriously?

It seems to me this leaves two fundamental questions on the table: (a) will quantum computing be the next great disruptive innovation that supplants silicone dioxide (Schneider, The U.S. National Academies reports on the prospects for quantum computing, 2018) (Schneider & Hassler, When will quantum computing have real commercial value? Nobody really knows, 2019) (Simonite, 2016); (b) What was the point of the presentation?

My answer to the first question is that I remain skeptical. When queried, the presenter said that the materials used were proprietary and would not be available for use by the audience. I will also say that there was a notable lack of specific information in the presentation materials that could be verified. This suggests the answer to the second question: the point of the presentation was a sales pitch. IBM seems to be building an ecosystem around this 50-qubit device that will solidify market share for what was admittedly the very earliest stage of quantum computing. IBM seems to be continuing in the tradition of Moore’s law being a social imperative not a physics-based phenomenon.

References

Dyakonov, M. (2019, March). The case against quantum computing. IEEE Specturm, pp. 24-29.

Grover’s algorithm. (2019, April 5). Retrieved from Wikipedia: https://en.wikipedia.org/wiki/Grover%27s_algorithm

Jordan, E. A. (2010). The semiconductor industry and emerging technologies: A study using a modified Delphi Method. Doctoral Dissertation. AZ: University of Pheonix.

Python (programming language). (2019, April 7). Retrieved from Wikipedia: https://en.wikipedia.org/wiki/Python_(programming_language)

Schneider, D. (2018, Dec 5). The U.S. National Academies reports on the prospects for quantum computing. Retrieved from IEEE Spectrum: https://spectrum.ieee.org/tech-talk/computing/hardware/the-us-national-academies-reports-on-the-prospects-for-quantum-computing

Schneider, D., & Hassler, S. (2019, Feb 20). When will quantum computing have real commercial value? Nobody really knows. Retrieved from IEEE Spectrum: https://spectrum.ieee.org/computing/hardware/when-will-quantum-computing-have-real-commercial-value

Shor’s algorithm. (2019, April 7). Retrieved from Wikipedia: https://en.wikipedia.org/wiki/Shor%27s_algorithm

Simonite, T. (2016, May 13). Morre’s law is dead. Now what? Retrieved from MIT Technology Review: https://technologyreview.com

The Future of Computers and Quantum Computing

Do you know what Gordon Moore actually said? In 1965 Gordon Moore observed that if you graphed in the increase of transistors on a planar semiconductor device using semi-log paper, it would describe a straight line. This observation ultimately became known as Moore’s law. The “l” is lower case in the academic literature because the law is not some grand organizing principle that explained a series of facts. Rather it was simply an observation. Moore adjusted the pronouncement in 1975 to set the vertical scale at every two years (Simonite, 2016). This so-called law has been the social imperative that has fueled innovation in the semiconductor manufacturing industry for well over 50 years. But it was a social imperative only (Jordan, 2010). It was clear from the beginning that the physics of the material would eventually get in the way of the imperative.

There is a physical limit to how far you can shrink the size of the individual devices using silicon dioxide, the underlying material of which all our electronics is made. That limit appears to be about 10 nanometers (Jordan, 2010; Simonite, 2016). There are also other more practical reasons why this limit may be unachivable such as heat disapation (Jordan, 2010). Although, given the cell phone industry seems to be driving the technology of late, significant strides have been made in reducing power consumption of these devices. This lower power consumption implies less heat generation. It also seems to imply getting away from a purely Van Neuman computational architecture toward a more parallel approach to code execution.

This brings us to the fundamental question: what technology is next? When will that technology emerge into the market place? My own research into these questions resulted in some rather interesting answers. One of the more surprising responses was the consensus about what was meant by emerging into the market place. The consensus of the Delphi panel I used in my research was when there was a full scale prototype ready for rigorous testing (Jordan, 2010). One of the most surprising answers addressed the consensus about what the technology would be that replaces silicon dioxide. My research suggests the replacement technology would be biologic in nature, RNA perhaps? The research also suggests this new technology would certainly emerge within the upcoming 30 years (Jordan, 2010). Given the research was conducted nine years ago, this suggests the new technology should be ready for full-scale prototype testing in about 20 years from now. I will address why this time frame is of significance shortly.

It turns out that this question of using RNA as a computational technology is being actively investigated. It would be difficult to predict to what extent this technology may mature over the next 20 years. But, in its current state of development, the computational speed is measured on the scale of minutes (Berube, 2019, March 7). Ignoring the problem of how one might plug a vat of RNA into a typical Standard Integrated Enclosure (SIE) aboard a US submarine, speeds on that scale are not particularly useful.

The Holy Grail of the next generation of these technologies is undoubtedly quantum computing (Dyakonov, 2019). There seems to be a lot of energy behind trying to develop this new technology with a reported “…laboratories are spending billions of dollars a year developing quantum computers.” (Dyakonov, 2019, p. 26). But we are left with the same question of when? Dyakonov divides projections into optimistic and “More cautious experts’ prediction” (p. 27). The optimists are saying between five and 10 years. The so-called more cautious prediction is between 20 and 30 years. This more cautious realm fit with my research as well (Jordan, 2010).

The real problem with achieving a working quantum computer is the shear magnitude of the technical challenges that must be overcome. In a conventional computer, it is the number of states of the underlying transistors that determine the computational ability of the machine. In this case a machine with N transistors will have 2N possible states. In the quantum computer, the device is typically the electron that will have a spin of up or down.  The probability of a particular electron spin being in a particular state varies continuously where the sum of the probability of up and the probability of down equaling 1. The typical term used to describe a quantum device used in this way is the “quantum gates” (Dyakonov, 2019, p. 27) or qubits. How many qubits would it take to make a useful quantum computer? The answer is somewhere between 1,000 and 100,000 (Dyakonov, 2019). This implies that to be able to make useful computations a quantum machine would have to something on the order of 10300 qubits. To illustrate how big a number that is I quote: “it is much, much greater than the number of sub-atomic particles in the observable universe.” (Dyakonov, 2019, p. 27). The problem is that of errors. How would one go about observing 10300 devices and correcting for errors? There was an attempt in the very early years of this century to develop a fault-tolerant quantum machine that used 50 qubits. That attempt has been unsuccessful as of 2019.

The basic research being done is of considerable value and much is being learned. Will we ever see a full-scale prototype ready for rigorous testing? I am beginning to doubt it. I am of the opinion that a usable quantum computer is not unlike controlled fusion: the ultimate solution, but always about 10 years out. So next year, our quantum computer (and controlled fusion for that matter) will not be nine years out but still another 10 years.


References

Dyakonov, M. (2019, March). The case against quantum computing. IEEE Specturm, pp. 24-29.

Jordan, E. A. (2010). The semiconductor industry and emerging technologies: A study using a modified Delphi Method. Doctoral Dissertation. AZ: University of Pheonix.

Simonite, T. (2016, May 13). Morre’s law is dead. Now what? Retrieved from MIT Technology Review: https://technologyreview.com


More prisoners in US than any other country: Criminal (In)Justice Scenarios

Here are Scenarios and sources of the injustice in the Criminal Justice system in the USA.

The US has the most people incarcerated of any country in the world… Even though we only have 4.3% of the world’s population, we have more inmates — 2.2 million — than China (1.5m) and India (0.3m), combined (36.4% of world population)! We have 23% of China’s population but 40% more incarcerated. We have almost 1% of our population (0.737%) incarcerated! We have 6 times higher incarceration rate than China, 12 times higher that Japan, and 24 times the rates in India and Nigeria. That’s right, an American has a 1,200% greater chance of being incarcerated than a Japanese citizen. We have even a 20% higher incarceration rate than Russia with 0.615% of their population in (Siberian) prisons and jails.

I know what you’re thinking, Americans must be more criminally inclined than any other country in the universe. And, no, it is not those *bleeping* Mexicans. The evidence shows that the Mexicans (legal or otherwise) cause less crimes than the typical “American”, plus crimes involving illegal Mexicans are far more likely to go unreported.

So now, I’m at a loss. Where did the criminal genes come from? You can’t really blame the American Indians.

Some of the ugly mechanisms and profits in the prison system are summarized nicely here in ATTN by Ashley Nicole Black, Who Profits from Prisons (Feb, 2015).

“There are currently [2.2 million] American in prisons. This number has grown by 500 percent in the past 30 years. While the United States has only [4.3] percent of the world’s population, it holds 25 percent of the world’s total prisoners. In 2012, one in every 108 adults was in prison or in jail, and one in 28 children in the U.S. had a parent behind bars.”

For years I heard stats that half of the people in prison in the USA were for non-violent (no weapon) drug offenses. That’s insane. It seems like the wrong people are institutionalized here. With the legalization of marijuana in many states these incarceration rates should be reducing (improving). July 2018 shows 46% of US inmates are for drug offenses: https://www.bop.gov/about/statistics/statistics_inmate_offenses.jsp

Okay, so what does that have to do with scenarios and scenario planning? What would be some of the scenarios that might lead to something more sane in terms of our incarceration rates. One approach would be to focus on those deflection points that might result in a lower level of criminals (criminal activity). Just one would be a new approach related to the prohibition of marijuana. As we learned from alcohol, prohibition doesn’t work. But there are several other ways to provide a mechanism for less criminal activity and/or less people incarcerated and/or less people incarcerated for so long. We’ll talk about two of our favorites at a later time: education and community engagement/involvement. (The Broken Window concept of fixing up the community and more local engagement is very intriguing. See article by Eric Klinenberg here.)

The big thing that escalated US incarceration rates was a get-tough-on-crime movement that began during the Nixon “I’m-not-a-crook” era. Part of this was obviously to have some tools to go after the hippies and the protesters. Tough on crime with mandatory sentences, lots of drug laws, and 3-strike laws came into being. Not to be outdone, as the toughest on crime, the 3-strikes moved to 2-strikes to, essentially 1-stike. As we filled up the prisons, we had to build more.

One current trend that should increase incarceration is the current epidemic of opioid-ish drug overdoses. Most forces, however, seem to be pushing toward reductions in incarceration.

Various scenarios should lead to a significant reduction in incarceration rates. The resulting scenario of low incarceration should have several ramifications. If you are in the business of incarceration, then business should – ideally – get worse and worse. Geo and Corrections Corp of America (now CoreCivic) should expect their business to drop off precipitously. Plus, there seem to be several movements away from private (or publicly traded) companies back toward government run prisons because private has been shown to be less effective — even if cheaper on the inmate-year bases.

Here’s a discussion of the business of incarceration. Note that the “costs” of incarceration are far, far more than the $50,000+/- it costs per year per inmate. Plus, having more people as productive members of society has them working (income and GDP) and paying taxes, not a dead weight on society.

Do you think that the relaxation of marijuana laws might be a “Sign Post” (in scenario terms) that indicates a rapid drop in prison population? Also, super full employment, might be a solution all by itself. People, especially kids, who can get jobs and do something more productive, may be less inclined to get into drugs and mischief? There’s no reason why the Sign Post need to be only one, or even two signs. In fact, the crime system is just a sub-system of an economy. Multiple reinforcing systems can be really powerful.

If we do take other approaches to the incarceration system, what would those approaches be? And who (what businesses/industries) would benefit most?

What do you think? Is it time to get out of the criminal (in)justice system?

Resources

Half of the world’s incarcerated are in the US, China and Russia: http://news.bbc.co.uk/2/shared/spl/hi/uk/06/prisons/html/nn2page1.stm

Incarceration Rates: https://www.prisonpolicy.org/global/2018.html

US Against the world: https://www.statista.com/statistics/300986/incarceration-rates-in-oecd-countries/

New Yorker Article in Sept 2016 by Eric Markowitz, Making Profits on the Captive Prison Market.

How for-profit prisons have become the biggest lobby no one is talking about, by Michael Cohen in 2015.

Follow the money, in 2017, with a great infographic as to where all the prison moneys go.

Salt and Battery, When does Storage make Fossil Fuel Obsolete

Last week the world’s biggest Electric Vehicle (EV) battery company made a big opening splash on its IPO. CATL is a Chinese company that IPOed with a massive 44% pop on open. The company offered up only 10% of the shares in the IPO, valuing the company at more than $12B. China has limits on how much a company can IPO at (price based on PE ratio) and a 44% limit on the amount an IPO can rise in first day of trading. Expect this company to jump continually for some time. CATL is now the largest EV battery company in the world, primarily with lithium-ion for autos.

Of course, you can just use power as needed, when needed. With the rapid increase in efficiencies of wind (where the wind blows) and solar (where the sun shines) this is becoming ever-more critical. Once the infrastructure of transmission lines are in place, the renewable power plants are far more cost effective than any other options. Both wind and solar are now less than $.02 per KW, and the combined wind-solar is coming in at less than $.03. Such new power can come onboard in months, not years or decades required for other types of power.

Still, the problem is smoothing out the power for night time when the wind is not blowing. Thus the reliance on storage if we are to move to total renewables. If – well, when – the combined renewable energy and storage costs are lower than coal, oil and natgas, there will be no need for fossil fuels, except maybe for those places where the sun doesn’t shine (much) and the wind doesn’t blow (much).

There are many different options for storage of energy.

Fixed storage can be in the form of solar that moves water (back upstream to a dam that is above the existing hydro power system). It can use mirrors to focus heat for molten salt, for example.

The old lead battery technology has been tried and proved for a century and still is alive and well in the golf-carts.

Many players are after the battery storage market. GE is fighting hard against Tesla (powerwall battery built in their GigaFactories for fixed and battery packs for their cars) and Siemens. Storage options that are as good, or better, then lithium are coming fast to market for different applications. See a great view of new battery technologies in Pocket Lint. Batteries technologies that contain more carbon, nickel or cobalt seem very intriguing. Hydrogen options using fuel cell has been right at the edge of mass breakthrough into the market for decades.

When will certain storage options become a game-changer for existing “built economy” such as fossil fuels?

At some point, the combined renewable and storage will be sufficiently powerful and affordable to render the old fossil fuel options obsolete. McKinsey report discusses this massive drop in price and trend in their battery report. In 2010 battery storage cost about $1,000 per kilowatt hour of storage; their June 2017 report shows it at $230 per kwh in 2016 and dropping fast. It should be well below $200 per kwh now. (Batteries for the Telsa Model 3 are supposed to be at about $190 per kWh based on mass manufacturing; estimates based on SEC filings are for $157 kWh by 2020.)

So, what is the break-even point where storage becomes the game changer, and renewables with battery deflect the entire energy industry onto another course? Apparently, $125 per kWh is the disruptive price point. A scientist name Cadenza has developed battery technology at this price point using super cell and is now working on an extended version that includes the peripherals with the battery at, or below, the magical $125 kWh. She must demonstrate both cheaper and safer, so the housing is critical to avoid fires and short-circuits. “In March of this year, Cadenza published its report (pdf) saying that its super-cell technology can indeed hit that point.”

The technology is already here, yet new improvements are leap-frogging each competing option. How long before fossil fuels are an obsolete option? For just plain generation, fossils are dead and dying. Combined is where the war is won, however.

We argue that you really want to be careful with your oil and gas investments because you can find yourselves, like the oil patch (countries and companies and refiners) with stranded assets.

Moore’s law is at work in the battery complex. How long before combined renewables with storage supplants fossil fuels? Five years? Ten? Twenty?

Scenarios of Stranded Assets in the Oil Patch

The researchers over at Strategic Business Planning Company have been contemplating scenarios that lead to the demise of oil. The first part of the scenario is beyond obvious. Oil (and coal) are non-renewable resources; they are not sustainable; burning fossil fuels will stop — eventually. It might cease ungracefully, and here are a few driving forces that suggest the cessation of oil could come sooner, not later. Stated differently, if you owned land that is valued based on carbon deposits, or if you owned oil stocks those assets could start to become worth less (or even worthless).

We won’t spend time on the global warming scenario and possible ramifications of government regulation and/or corporate climate change efforts. These could/would accelerate the change to renewables. There are other drivers away from fossil fuels including: National Security, Moore’s Law toward renewables; and, efficiency.

1. National Security. Think about all the terrorist groups and rogue countries. All of them get part, or all of their funding from oil (and to a lesser extent, NatGas and Coal). Russia. Iran. Lebanon, where the Russians have been enjoying the trouble they perpetuate. The rogue factions in Nigeria. Venezuela. Even Saudi is not really are best friend (15 of the 19 bombers on 911 were Saudi citizens). Imagine if the world could get off of fossil fuels. Imagine all the money that would be saved, by not having to defend one countries aggression on another if the valuable oil became irrelevant. Imagine how much everyone would save on military. This is more than possible with the current technology; but with Moore’s law of continuous improvement, it becomes even more so.

2. Moore’s Law. Moore’s law became the law of the land during the computer chip world, where technology is doubling every 18 months, and costs are reducing by half.  (See our blog on The Future of Computing is Taking on a Life of Its Own. After all these decades Moore’s law is finally hitting a wall.) In the renewable world, the price of solar is dropping dramatically, when the efficiency continues to increase. For example the increase of 30% on imported PV, matches the cost reductions of the last year. In the meanwhile battery efficiency is improving dramatically, year-over-year. Entire solar farms have been bid (and built) for about $.02 per kilowatt and wind and/or solar with battery backup is about $.03 per kilowatt. At that price, it is far cheaper to install renewable power vs coal or NatGas, especially given the years to create/develop for fossil fuel plants.

Note, that we haven’t even talked about peak coal and peak oil. Those concepts are alive and well, just that fracking technology has pushed them back maybe 10 years from a production supply-side perspective. At some point you hit the maximum possible production (on a non-renewable resource) and production can only go down (and prices go up) from there. The world production of oil is now up to 100m barrels per day.  But oil wells deplete at about 4%-5%, so you need 4% more new wells every year. Fracking drops about 25%-30% in the first year! So you need about many more wells each year to stay even. But let’s go on to efficiency and probably the major demand-side force.

3. Efficiency. The incandescent light bulb, produces very little light… it produces more than 95% heat, and just a tiny bit of light with 100 watts of energy. With only 10-15 watts an LED light can produce the same light was required 100 watts in days of old. The internal combustion engine is hugely inefficient, producing mostly (unused) heat and directly harnessing only 10-15% of energy from gas or diesel… plus it took huge amounts of energy to mine, transport, refine, transport, and retail the fuel. Electric engines are far more efficient, and they produce no toxic emissions. A great book that talks about energy, efficiency and trends is by Ayers & Ayers, Crossing the Energy Divide. The monster power plants (nuclear, coal, NatGas) have serious efficiency issues. They produce huge amounts of heat for steam turbines, but most of the heat is lost/wasted (lets say 50%). Electricity must be transmitted long distances through transmission lines (where up to 40% can be lost in transmission).

Producing power as needed, where needed, makes so much more sense in most cases. Right now, using today’s technology, pretty much everyone can produce most of their own power (PV or wind) at about the same cost as the power monopolies.  But Moore’s law is making the renewable technology better and better every year. Add some batteries and microgrid technology and you have robust electric systems.

The losers in these trends/scenarios can be the BIG oil companies and the electric monopolies. They will fight move until they change, or they lose. Just like peak oil, it is a mater of time… but the time is coming faster and faster…

Saudi is trying to keep prices high enough to complete their oil Initial Public Offering so they can diversify out of oil. Venezuela is offering a new cyber coin IPO (their Petro ICO) with barrels of buried oil as collateral (See Initial Kleptocurrency Offering). But what if that oil becomes a stranded asset? Your Petro currency becomes as worthless as the Venezuelan Bolivar.

You really want to carefully consider how much and how long you want to own fossil fuel assets… Fossil fuels may be dead in a decade or two… Moore or less.

Triangulation to augment your Qual study

Triangulation in research is a lot the old technology of geometry and surveying where you take the distance from three known points to compute the exact location on a map… Give or take a few yards. LORAN technology using radio signals and such was used in WWII. With a LORAN in the gulf, I remember being able to find where we were on a sail boat, approximately. The problem was that we were in an area of the Gulf of Mexico with only two LORAN readings. Three, you can triangulate, two you can approximate.

Triangulation in Academic Research is the kind of stuff you can possibly do to augment your Qual study. As discussed other places, Delphi Studies might need to be recharacterized as Mixed method if some of the research is sufficiently quantitative, i.e., if second round has a lot of respondents and it makes sense to do stats, like correlation on several variables.

So, in any qual study, you might consider including triangulation. There are a few types of triangulation (depending on your source) but let’s focus on just two: data and lit/theoretical. Data would be if you could find published statistics in the area that would allow for some corroboration of the findings from the study. In terms of data, maybe some stats that give an estimate of the independent and/or dependent variables (predictor and predicted variables in QUAL world). Possibly even the intersection of the two. Does the available data align with the findings of the study?

Internal data to a study should be kept separate from external data triangulation. In Delphi studies, for example, there might be an alignment of the more general findings from round 1 and rankings of round 2. This offers up internal consistency.

One of the coolest, and potentially strongest, aspects of triangulation is literature (or theory) triangulation. Does the existing literature align with some of the key themes found in your QUAL study. Think of this as a meta-study lite. For a meta study, there needs to be a lot of research, and a deep dive into the existing research can allow for a table of results that support, don’t support, or disprove various themes.

Here is a very interesting approach for triangulation within a Delphi study (Hopf, Francis, Helms, Haughney, & Bond, 2016). Find the article here at BMJopen. For past studies that did not address a specific topic, they used a bazaar label of “Silence”, as in not addressed in the specific study. A better label would probably not addressed (n.a.). (The implication of silence is that the authors intentionally avoided that specific issue in their study.)

So, consider including one of the 4 or 5 types of triangulation in your qual study to strengthen the support for your findings (or to highlight divergent findings). For the regular researcher (say dissertation), consider simply doing meta analysis, and avoid all that messy questionnaire stuff, if the field is full of existing research.

If you use Delphi, you will be able to project into the future. You can explore how some of the themes identified in the research grow or wane in an uncertain future, and what conditions (triggers) might initiate major future disruption, i.e., scenario analysis.

References

Hopf, Y. M., Francis, J., Helms, P. J., Haughney, J., & Bond, C. (2016). Core requirements for successful data linkage: an example of a triangulation method. BMJ Open, 6(10), e011879. doi:10.1136/bmjopen-2016-011879 Retrieved from: http://bmjopen.bmj.com/content/6/10/e011879


Consensus: Let’s agree to look for agreement, not consensus

Most of the hunters (academic researchers) searching for consensus in their Delphi research, are new to the sport. They believe that they must bag really big game or come home empty handed. But we don’t agree. In fact, once you have had a chance to experience Delphi hunting once or twice, your perception of the game changes.

Consensus is a BIG dilemma within Delphi research. However, it is generally an unnecessary consumer of time and energy. The original Delphi Technique used by the RAND Corporation wanted to aim for consensus in many cases. That is, the U.S. government could either enter an nuclear arms race or not; there really was no middle ground.  Consequently, it was counterproductive to build a technique that could not reach consensus.  It became binary: reach consensus and a plan could be recommended to the president; no consensus, and this too was useful, but less helpful, to inform the president. (The knowledge that the experts could not come up with a clear path forward, when exerting a structured assessment process, is also very good to know.)

Consensus. The consensus process – getting teams of experts to think through complex problems and come up with the best solutions – is critical to effective teamwork and to the Delphi process. In most cases, however, it is not necessary – or even desirable – to come up with the one and only best solution. So long as there is no confusion about the facts and the issues, forcing a consensus when there is none is counter-productive (Fink, Kosecoff, Chassin & Brook, 1984; Hall, 2009, pp. 20-21).

Table 1 shows the general characteristics of various types of nominal group study techniques (Hall & Jordan, 2013, p. 106). Note that the so called traditional Delphi Technique and the UCLA-RAND appropriateness approaches aim for consensus. The so call Modified Delphi might not search for consensus and might not utilize experts. Researchers use the UCLA-RAND approach extensively to look for the best medial treatment protocol when only limited data is available, relying heavily on the expertise of the doctors involved to suggest – sometimes based on their best and informed guess – what protocol might work best. The doctors can only recommend one protocol. Consensus is needed here. 
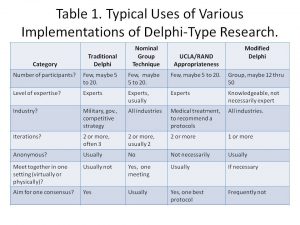
(Table reprinted with permission Hall and Jordan (2013), p. 106).

But consensus is rarely needed, although it is usually found, to some degree, in business research, and even in most academic research. For example, the most important factors may be best business practices. Of the total list of 10 to 30 factors, few are MOST important. Often, the second round of Delphi aims to prioritize those qualitative factors identified in round 1. There factors are usually natural separation points between the most important (e.g. 4.5 out of 5), those that are medium important (3 out of 5), and the low importance factors.

Those researchers who are fixated on consensus might spend time, maybe a lot of time, trying to find that often elusive component called consensus. There are usually varying levels of agreement. Five doctors might agree on one single best protocol, but 10 probably won’t, unanimously. Interestingly, as the number of participants increase, the ability to talk statistically significantly about the results increases; however, the likelihood of pure, 100% consensus, diminishes. For example, a very small study of five doctors reaches unanimous consensus; but when it is repeated with 30 doctors, there is only 87% agreement. Obviously, one would prefer the quantitative and statistically significant results from the second study. (Usually you are forecasting with Delphi; 100% agreement implies a degree of certainty in an uncertain future, essentially this can easily result in a misapplication of a very useful planning/research tool.)

This brings us to qualitative Delphi vs. a more quantitative, mixed-method, Delphi. Usually Delphi is considered QUAL for several reasons. It works with a small number of informed, or expert, panelists. It usually gathers qualitative information in round 1. However, the qualitative responses are prioritized and/or ranked and/or correlated in round 2, round 3, etc. If a larger sample of participants results in 30 or more respondents in round 2, then the study probably should be upgraded from a purely qualitative study to mixed-method. That is, if the level of quantitative information gathered in round 2 is sufficient, statistical analysis can be meaningfully applied. Then you would look for statistical results (central tendency, dispersion, and maybe even correlation). You will find a confidence interval for all of your factors, those that are very important (say 8 or higher out of 10, +/- 1.5) and those that aren’t important. In this way, you could find those factors that are both important and statistically more important than other factors: a great time to declare a “consensus” victory.

TIP: Consider using more detailed scales. As 5-point Likert-type scale will not provide the same statistical detail as a 7-point, 10-point or maybe even a ratio 100% scale if it makes sense.

Subsequently, in the big game hunt for consensus, most hunters continue to look for the long-extinct woolly mammoth. Maybe they should “modify” their Delphi game for an easier search for success instead . . .

What do you think?

References

Hall, E. (2009). The Delphi primer: Doing real-world or academic research using a mixed-method approach. In C. A. Lentz (Ed.), The refractive thinker: Vol. 2: Research Methodology, (pp. 3-27). Las Vegas, NV: The Refractive Thinker® Press. Retrieved from: http://www.RefractiveThinker.com/

Hall, E. B., & Jordan, E. A. (2013). Strategic and scenario planning using Delphi: Long-term and rapid planning utilizing the genius of crowds. In C. A. Lentz (Ed.), The refractive thinker: Vol. II. Research methodology (3rd ed.). (pp. 103-123) Las Vegas, NV: The Refractive Thinker® Press.

Page 2 of 3

Powered by WordPress & Theme by Anders Norén